Table of Contents
Understanding the Power of Infographics
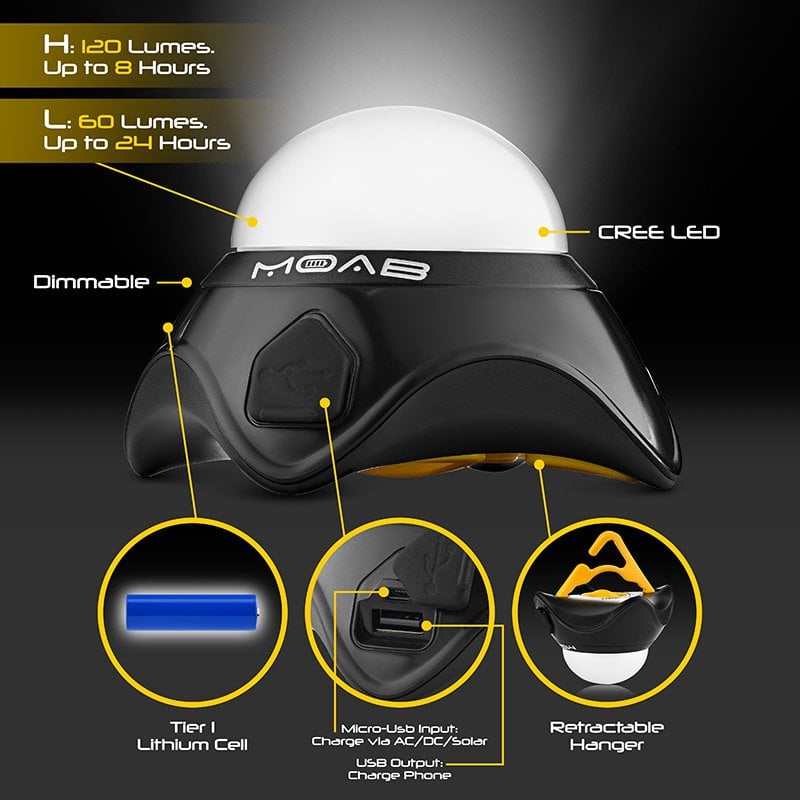
Infographics are visual representations of information that use graphic elements to present a message. They condense complex data into easily digestible visuals, making them highly effective in capturing and maintaining the viewer’s attention. This is particularly important on Amazon, where sellers compete fiercely for customer attention.
Infographics can enrich your Amazon presence, boost your brand image, and significantly increase your conversion rates.
Why Infographics are Essential for Amazon Marketing
Amazon is a platform where visuals play a crucial role in influencing purchasing decisions. Infographics, with their ability to present a wealth of information in a visually appealing format, can significantly enhance your product listings. They not only provide a comprehensive overview of your product but also help build trust with customers by offering clear, concise, and valuable information.
Moreover, infographics can boost your brand presence. According to research, infographics are 30 times more likely to be read than text-based content. They also generate 12% more traffic and are shared three times more on social media than any other content type. This makes them a powerful tool for increasing brand visibility and engagement.
Types of Infographics for Amazon

The type of infographic you choose to create depends largely on your product and its unique selling points. Here are some common types of infographics used on Amazon:
- Statistics-based content: These infographics present data related to your product in a visually appealing way. For instance, customer satisfaction rates, product performance statistics, etc.
- Timelines and manufacturing processes: These infographics provide a visual representation of your product’s development process or history.
- Comparisons: These infographics compare your product with others in the market, highlighting its unique features and benefits.
- Lists of benefits: These infographics list the benefits of using your product, making it easy for customers to understand its value.
- Before and after images: These infographics show the effectiveness of your product by comparing before and after images.
Choosing the right type of infographic requires a deep understanding of your product and your target audience. It’s crucial to present information that resonates with your customers and persuades them to make a purchase.
Creating Effective Amazon Infographics
Creating an effective infographic requires careful planning, creativity, and a clear understanding of your product and audience. Here are some steps to guide you through the process:
Understand your audience: Identify who your customers are and what information they find valuable. This will help you decide what content to include in your infographic.
- Highlight key information: Identify the most important features or benefits of your product and ensure they are prominently displayed in your infographic.
- Design with clarity: Your amazon ographic should be clear and easy to understand. Avoid clutter and ensure that the design elements enhance the information rather than distract from it.
- Use compelling visuals: Use high-quality images, icons, and graphics to make your infographic visually appealing. Remember, the goal is to attract and retain the viewer’s attention.
- Keep it consistent: Ensure that your infographic aligns with your brand image and style. Consistency in design elements like color, typography, and imagery can enhance brand recognition.
- Proofread and edit: Make sure your infographic is free of errors and presents information accurately. Misinformation or typos can harm your brand image and credibility.
Creating effective infographics requires a blend of creativity, design skills, and a deep understanding of your product and audience. If you’re not confident in your design abilities, consider hiring a professional designer or using online design tools like Canva.
Enhancing Your Amazon Listing with Infographics

Once you’ve created your infographics, it’s time to incorporate them into your Amazon listing. Here are some tips to help you do this effectively:
- Place important infographics first: Amazon allows up to nine images for each product. Make sure to place your most important infographics at the beginning to capture the viewer’s attention immediately.
- Use high-resolution images: High-resolution images look more professional and are easier to read. Amazon recommends using images that are at least 1000 pixels in either width or height.
- Optimize for mobile: More than half of Amazon’s traffic comes from mobile devices. Ensure that your infographics are easy to view and read on smaller screens.
- Test and optimize: Monitor your listing’s performance and make necessary adjustments. If an infographic isn’t performing well, consider revising it or replacing it with a more effective one.
Infographics can significantly enhance your Amazon listing by providing valuable information in a visually appealing format. However, creating effective infographics requires careful planning, creativity, and a deep understanding of your product and audience.
Case Study: Infographics in Action
To illustrate the power of infographics, let’s consider a case study. Pro Photo Studio, a professional photography studio, leveraged infographics to enhance their Amazon listings for camera products. They used infographics to highlight key features, compare products, and provide detailed information about their products in a visually appealing way.
For example, in their listing for a DSLR camera, they used an infographic to compare the camera with a mirrorless camera. This infographic not only highlighted the unique features of the DSLR camera but also helped customers make an informed purchasing decision by providing a clear comparison.
In another listing for a camera protector, they used an infographic to list the benefits of using the protector. This infographic not only provided valuable information but also persuaded customers of the value of the product.
Through the strategic use of infographics, Pro Photo Studio was able to enhance their Amazon listings, increase customer engagement, and boost their conversion rates.
Conclusion.
Infographics are a powerful tool for enhancing your Amazon listings. They can help you present complex information in a visually appealing and easily digestible format, making it easier for customers to understand your product’s features and benefits. By using infographics strategically, you can increase customer engagement, improve your conversion rates, and ultimately boost your sales on Amazon.
Remember, creating effective infographics requires a deep understanding of your product and audience, as well as creativity and design skills. Whether you’re designing your infographics yourself or hiring a professional, it’s important to keep your audience and the platform’s guidelines in mind to ensure your infographics are effective and compliant.
Finally, don’t forget to monitor your listing’s performance and make necessary adjustments. As with any marketing strategy, testing and optimization are key to success.
For more insights and tips on product photography and marketing, check out the Pro Photo Studio blog.
FAQs
Amazon infographics are visual representations of information used in product listings on Amazon. They are designed to present complex product details in an easily digestible and visually appealing format, helping to capture and retain customer attention.
nfographics are crucial for Amazon marketing as they enhance product listings by providing a comprehensive overview of the product in a visually appealing way. They help build trust with customers by offering clear, concise, and valuable information, leading to increased customer engagement and improved conversion rates.
Common types of infographics used on Amazon include statistics-based content, timelines and manufacturing processes, product comparisons, lists of benefits, and before and after images. The choice of infographic type largely depends on the product and its unique selling points.
Creating effective Amazon infographics requires understanding your audience, highlighting key information, designing with clarity, using compelling visuals, maintaining brand consistency, and proofreading for accuracy. If you’re not confident in your design abilities, consider hiring a professional designer or using online design tools.
Infographics can be incorporated into your Amazon listing by placing important infographics first, using high-resolution images, optimizing for mobile viewing, and regularly testing and optimizing based on performance.
Infographics can significantly enhance your Amazon listing by providing valuable information in a visually appealing format. They can increase customer engagement, improve your conversion rates, and ultimately boost your sales on Amazon.
Yes, the article provides a case study of Pro Photo Studio, which leveraged infographics to enhance their Amazon listings for camera products. They used infographics to highlight key features, compare products, and provide detailed information about their products in a visually appealing way, leading to increased customer engagement and boosted conversion rates.
if you’re looking to increase your online conversion but still feel you are not sure where to start – check out these resources below:


